Use ggplot2 package to plot the heatmap of a single periodogram or kernel
spectral density estimate.
Usage
plot_period(
  period,
  freq.list = NULL,
  type = "Re",
  title = NULL,
  palette = "Spectral",
  legend.range = NULL
)
Arguments
- period
Matrix. Output from
periodogram()orperiodogram_smooth().- freq.list
List. Output from
generate_freq()withreturn.comb = TRUE.- type
If
type = "Re"(default), plot the real part of the estimate. Iftype = "Im", plot the imaginary part. This argument is useful for cross- spectrum estimate, which is complex-valued.- title
Character. The title of the plot.
- palette
Color schemes for visualization. Type
?ggplot2::scale_fill_distiller()to check available options.- legend.range
Specify
c(lower, upper)to manually set the lower and upper bound of the spectral density to visualize.
Examples
library(spatstat)
lam <- function(x, y, m) {(x^2 + y) * ifelse(m == "A", 2, 1)}
set.seed(227823)
spp <- rmpoispp(lambda = lam, win = square(5), types = c("A","B"))
KSDE.list <- periodogram_smooth(spp, inten.formula = "~ x + y", bandwidth = 1.15)
names(KSDE.list)
#> [1] "A, A" "A, B" "B, B"
freq.list <- attr(KSDE.list, "freq.list")
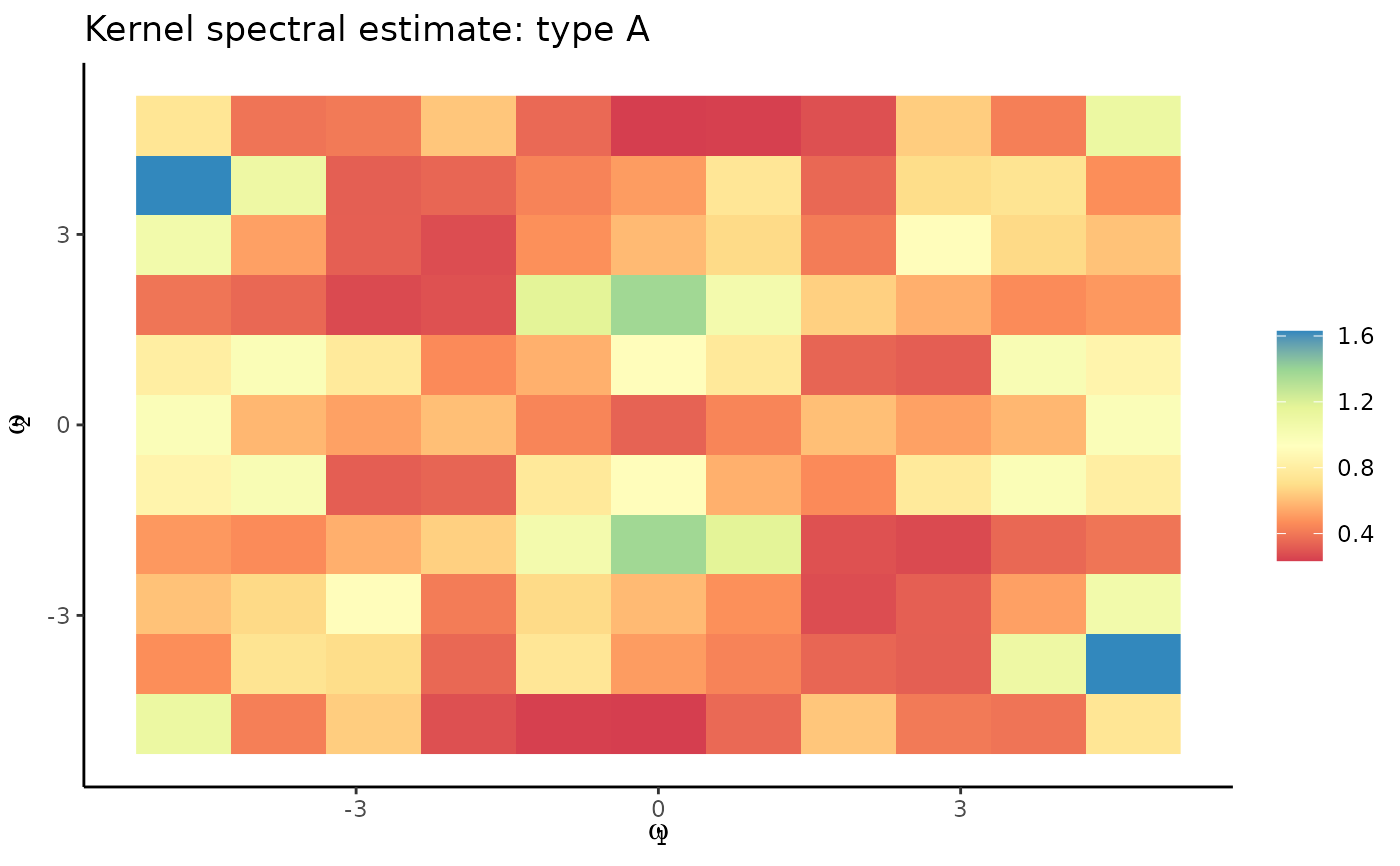
plot_period(KSDE.list[[1]], freq.list = freq.list,
title = "Kernel spectral estimate: type A")
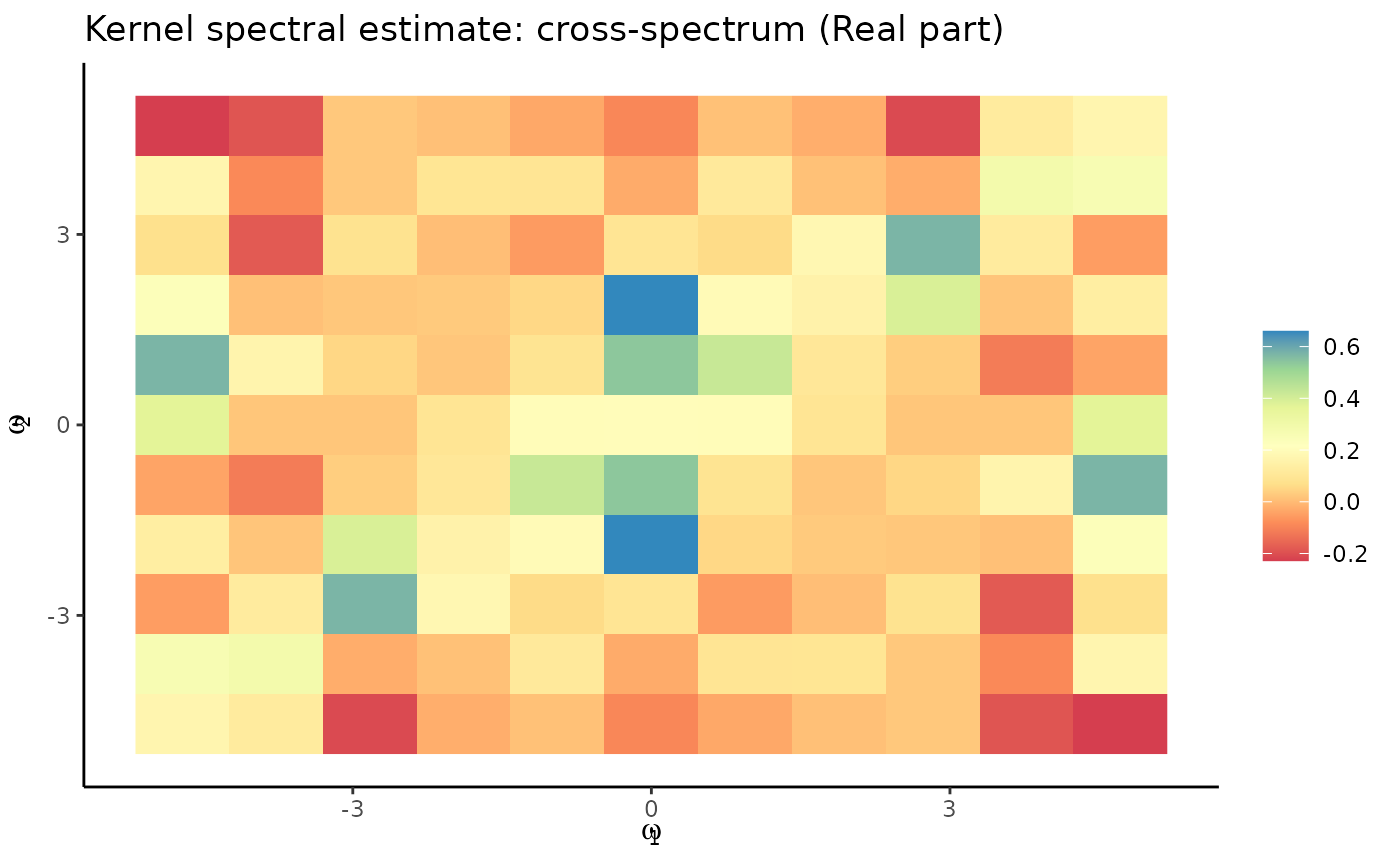
 plot_period(KSDE.list[[2]], freq.list = freq.list,
title = "Kernel spectral estimate: cross-spectrum (Real part)")
plot_period(KSDE.list[[2]], freq.list = freq.list,
title = "Kernel spectral estimate: cross-spectrum (Real part)")
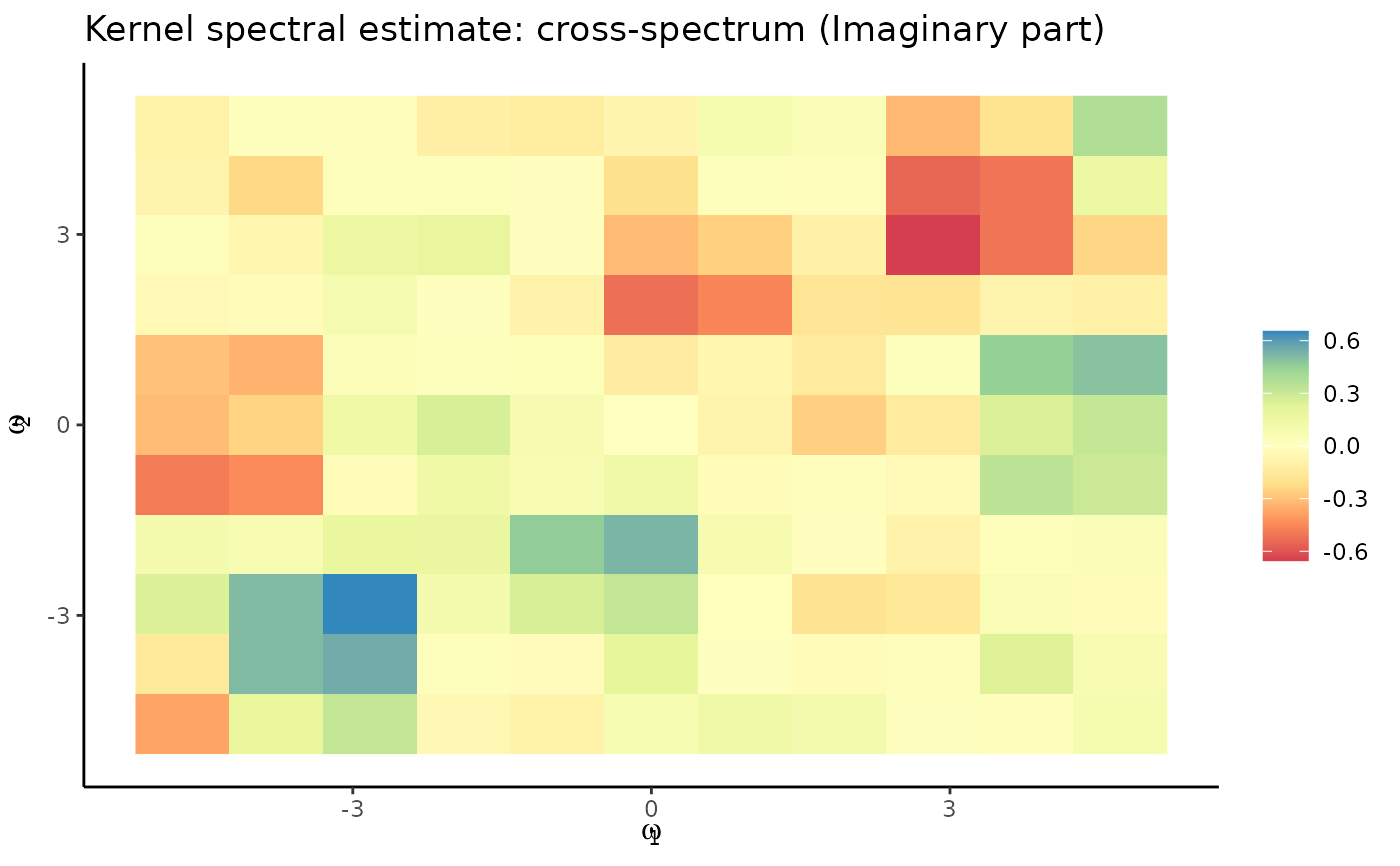
 plot_period(KSDE.list[[2]], freq.list = freq.list, type = "Im",
title = "Kernel spectral estimate: cross-spectrum (Imaginary part)")
plot_period(KSDE.list[[2]], freq.list = freq.list, type = "Im",
title = "Kernel spectral estimate: cross-spectrum (Imaginary part)")
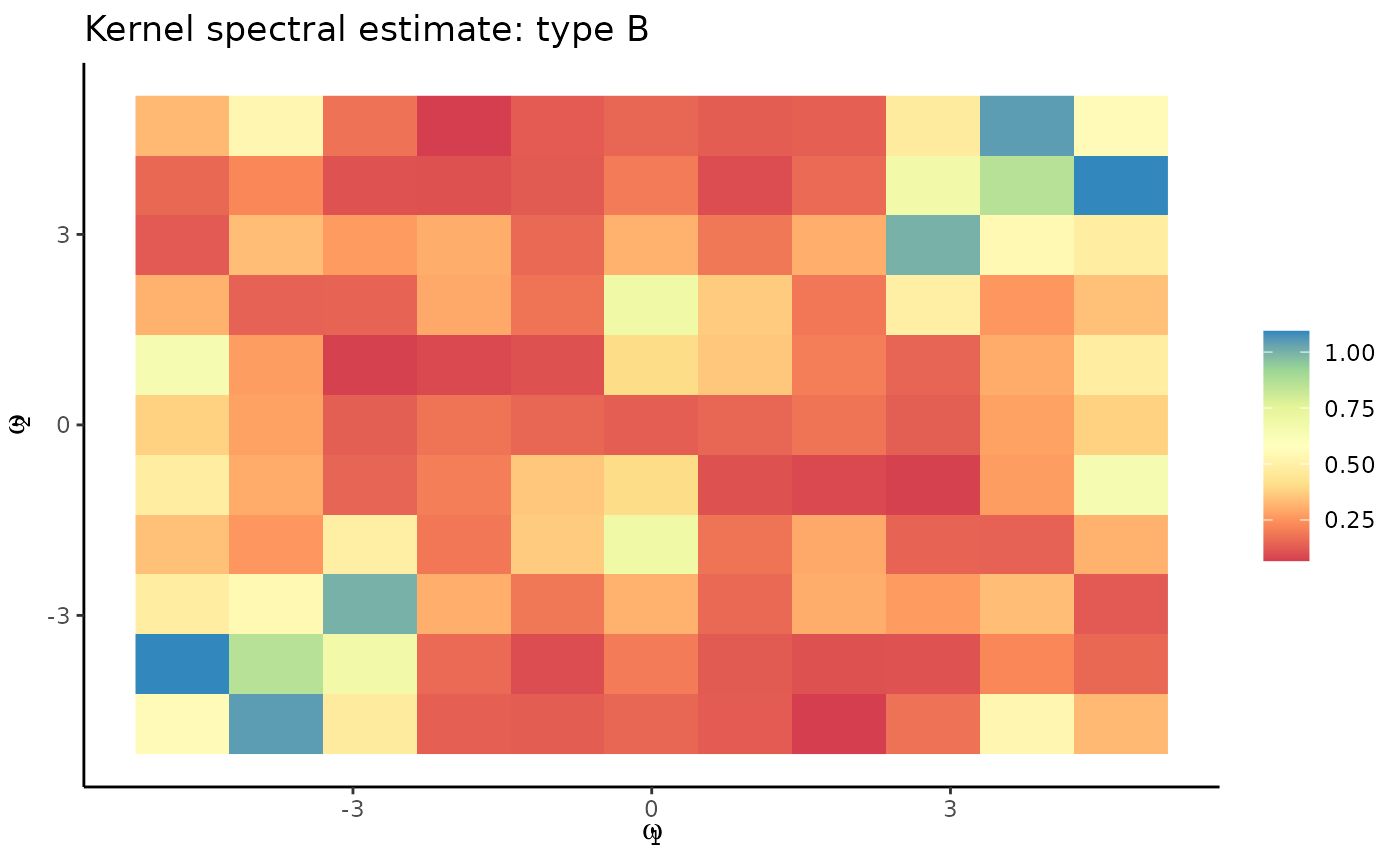
 plot_period(KSDE.list[[3]], freq.list = freq.list,
title = "Kernel spectral estimate: type B")
plot_period(KSDE.list[[3]], freq.list = freq.list,
title = "Kernel spectral estimate: type B")